The XRM Banking solution, thanks to the tools of the Monitoring Panels and the Report Wizard, provides the manager with extensive analysis capabilities for making qualitative changes and developing recommendations for sales and service processes (for example, rules for selling related products or services, developing active sales scripts, etc.)
The head is available analytical data on sales and service "from any angle," including:
- Analysis of transactions and customers by volume of business, geography, subdivisions, executors, product, period
- Analysis of the channels of the service for popularity and other parameters
- Analysis of the number of authorized applications, FCR, AHT, etc.
- Service load forecast for capacity planning
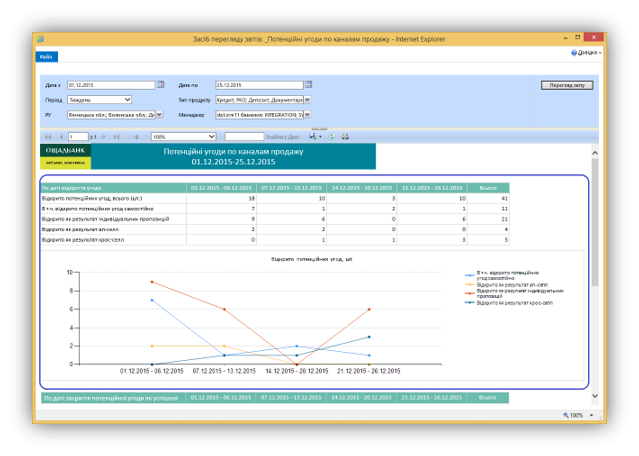
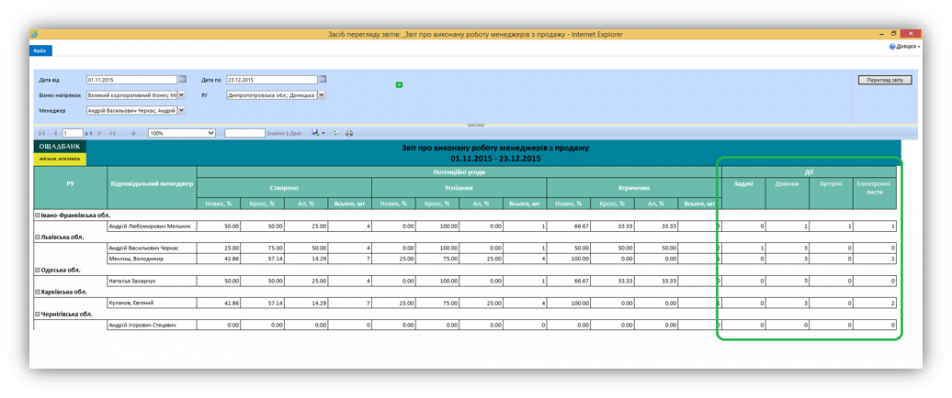
These reports display information on the total number of potential deals created, new potential deals, potential deals open as a result of individual offers, Cross- and Up-Sell. The number of successful and lost potential deals is shown. Also, the number of scheduled and completed meetings and calls related to this potential transaction is displayed
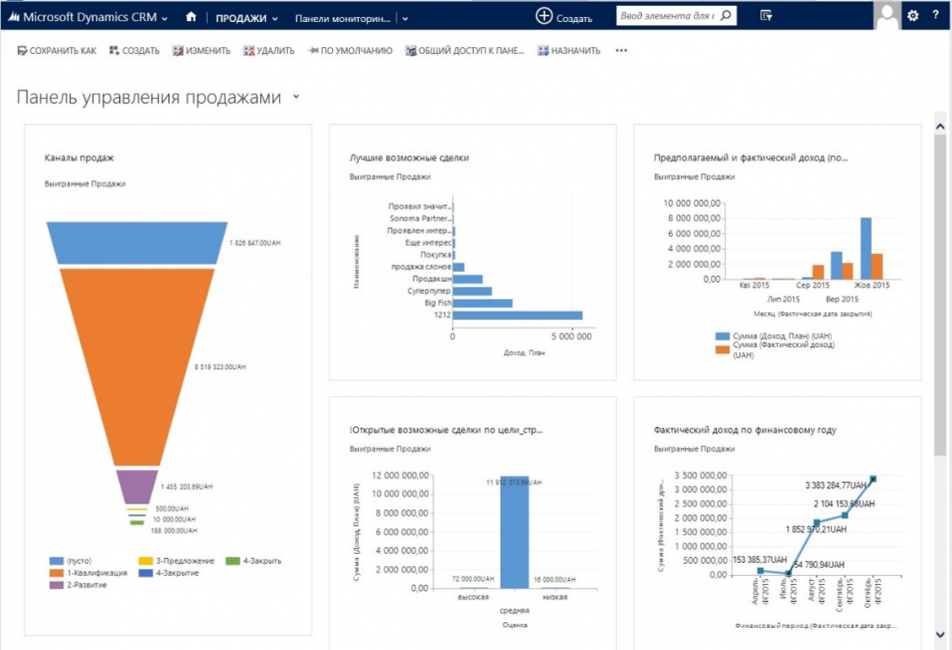
The classic "sales funnel" tool in combination with the product catalog, segmentation tools allows you to get a financial forecast for transactions in terms of products, territories, units, as well as the budget (importance) of transactions, which allows not only to see the overall picture of the financial result, but also to take operational management decisions, as well as to identify priority areas for setting monitoring tasks.
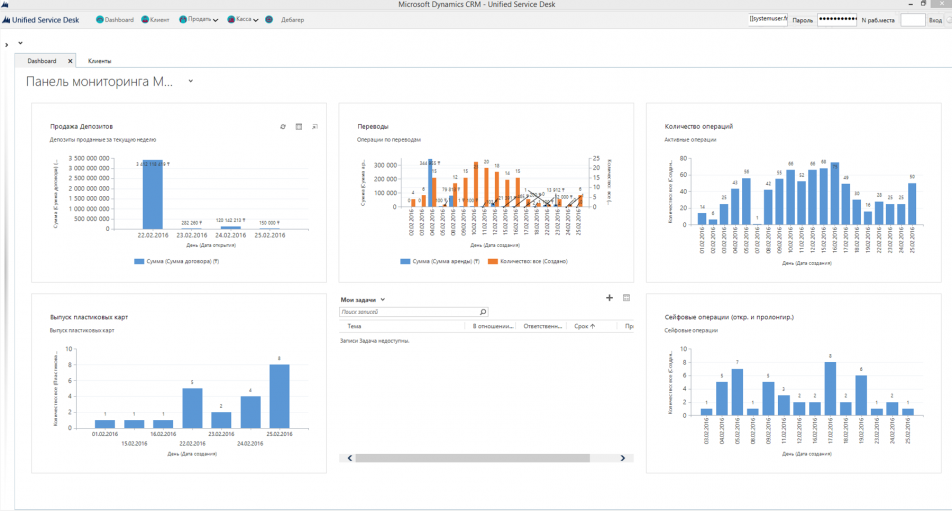
To monitor the actions of sales managers configured views and dashboards for managers. They show all the basic information about the activities of the manager. Visualization allows you to "fall through" the data to understand where these or other figures and indicators come from.
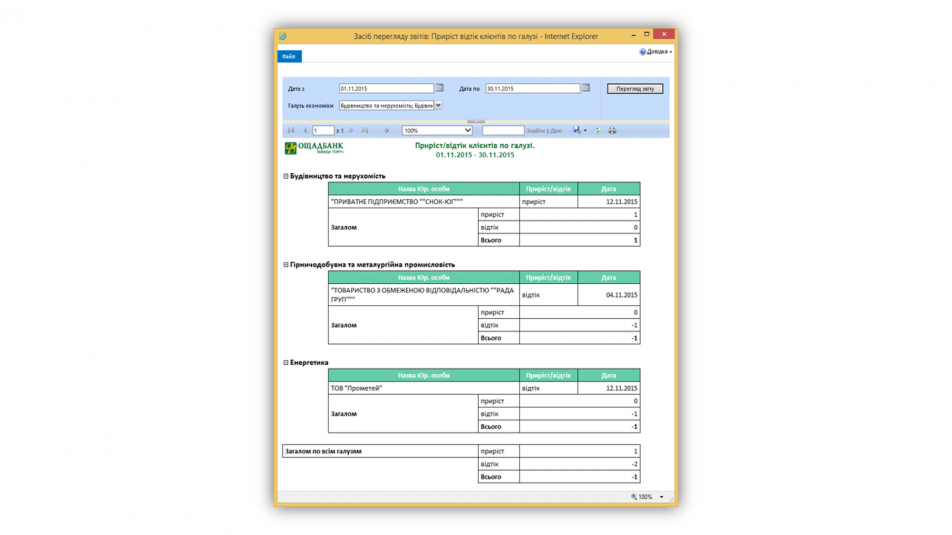
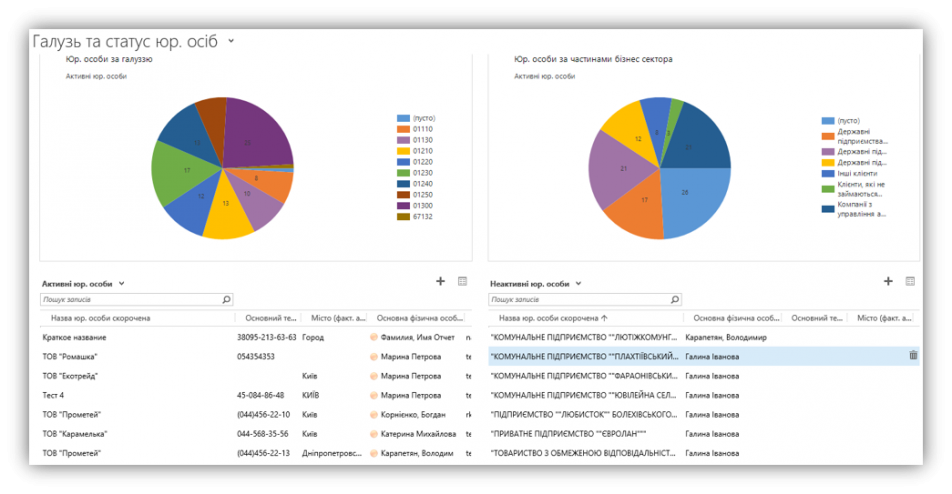
To monitor the client base, reports were made on the growth/outflow of clients - legal entities grouped by industry, segment, territory and sales managers.
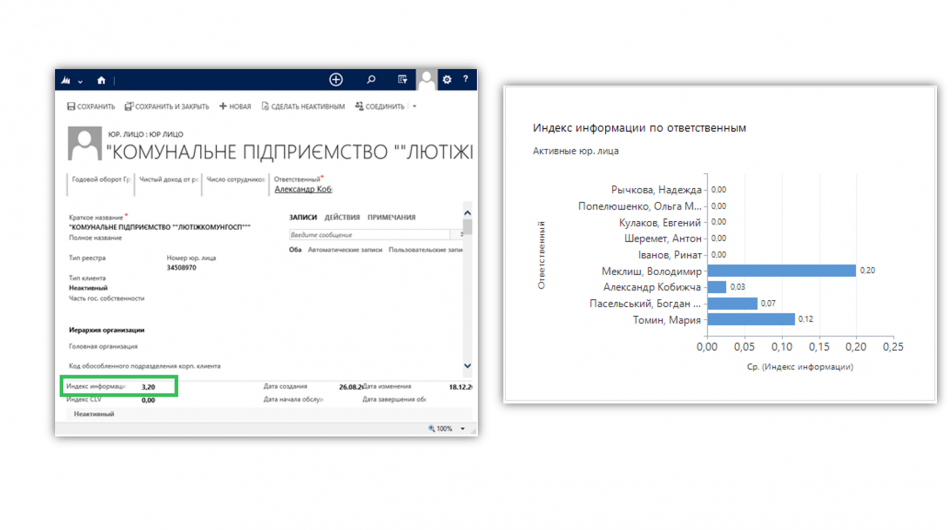
The index of data completeness (SDI) is the indicator of the fullness of the target attributes of the customer's card. In the customer card The index of completeness of data is displayed in a numerical field (from 0 to 10), accordingly we build diagrams for the control of the client base and the work of managers, and it is also possible to adjust system goals to achieve this indicator.
To monitor the quality of the sales manager, the following reports are implemented:
Report on violation of regulations in the work of sales managers, which displays information about potential agreements that are in the works
Report on the work done by sales managers. Shows the number of potential deals created and related cases
The effectiveness of processing individual product proposals, which reflects the promotional offers and the results of the elaboration of these proposals
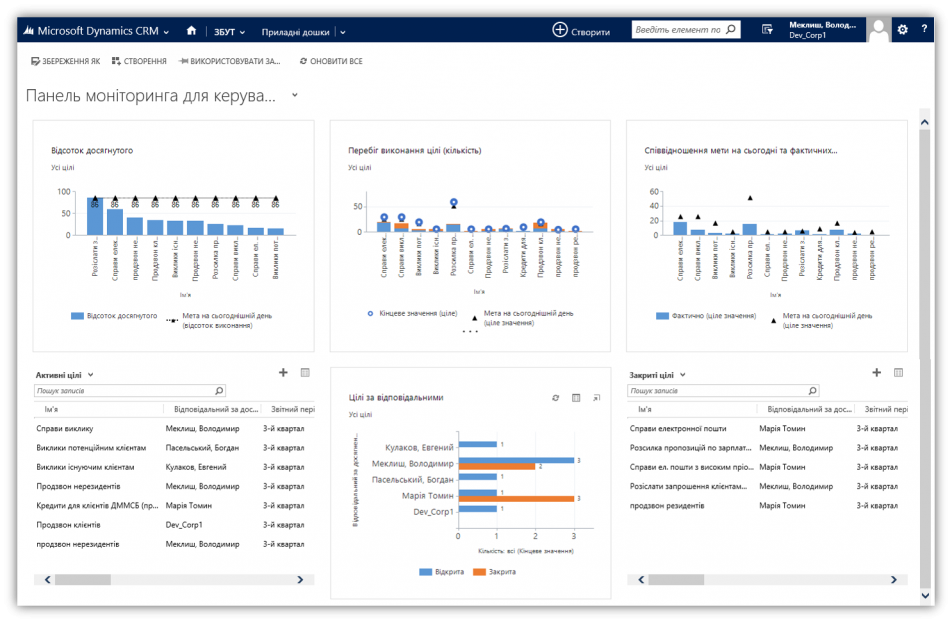
The KPI management tool provides the formation and monitoring of individual and group sales plans (with details on the territories, subdivision and the seller), as well as provides tools for operational tracking (control) of the fulfillment of goals.
The tool allows you to specify the hierarchical structure of goals and the relationship between financial and quantitative indicators.